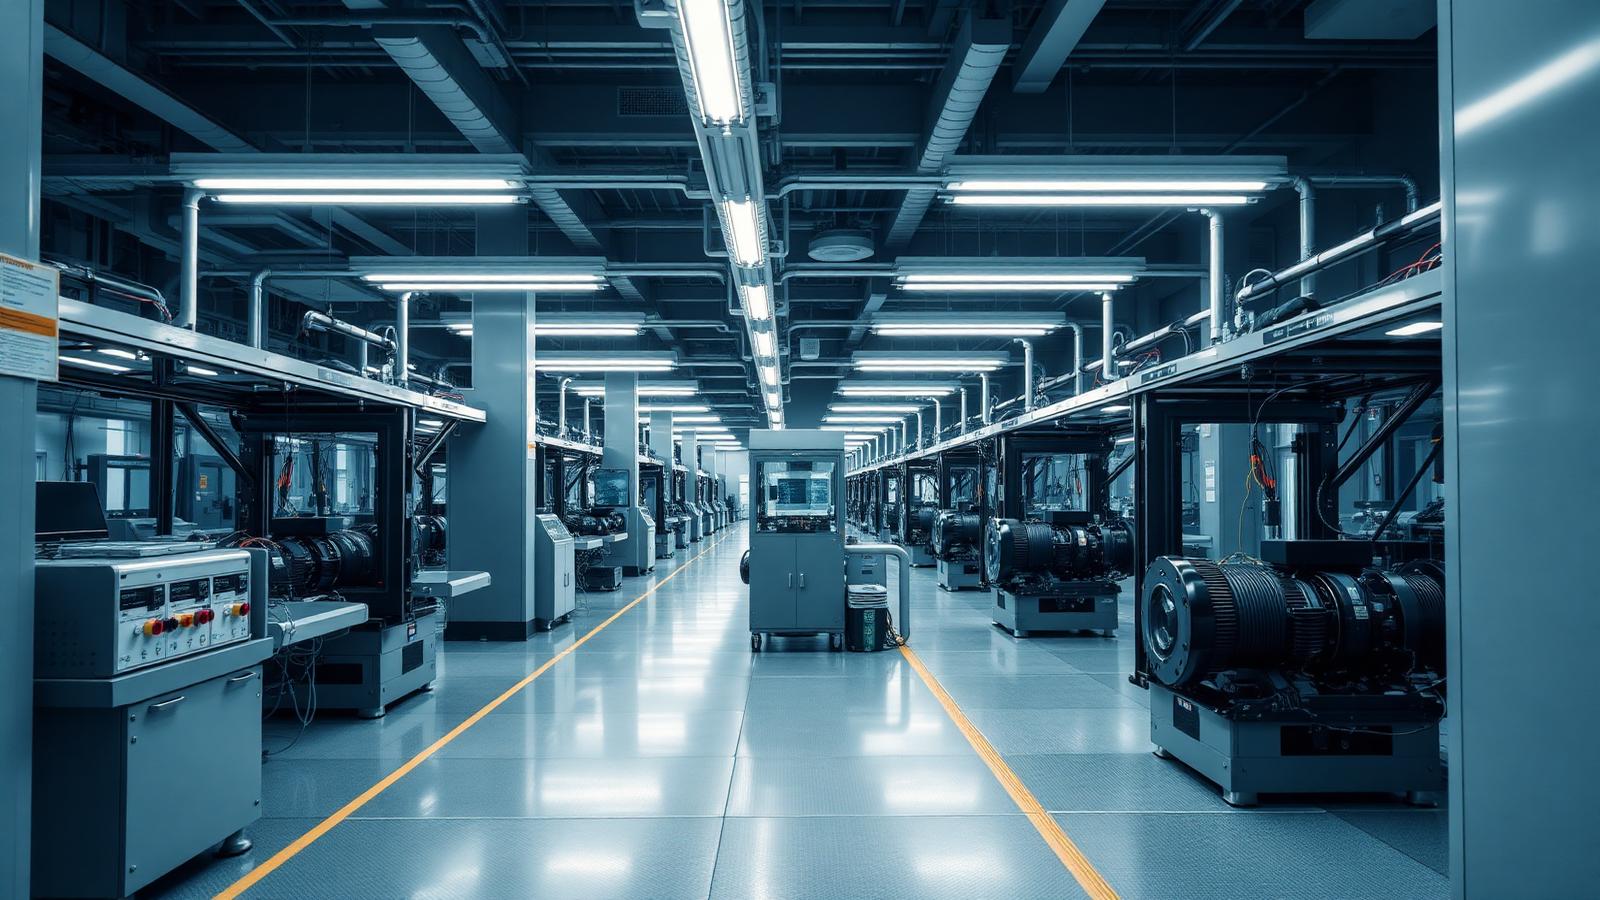
Precision electric drive assembly line with automated stations in a clean production hall.

Automotive Electronics and eMobility

From Fragmented Launches to Repeatable Performance

Rebuilding an eMobility industrialization system across a portfolio of approximately US$1 billion in lifetime value, lifting average OEE from 59% to 84%.

59% to 84%
Average portfolio OEE
94%
Peak OEE on leading lines
10+
Industrialization projects delivered
~US$1B
Lifetime program value
120+
People in the industrialization organization

The Challenge

A global automotive electronics and drive-systems manufacturer was industrializing multiple eMobility programs across four product lines.

Collectively, the programs represented approximately US$1 billion in lifetime value. Their successful launch depended on converting complex product designs into stable, scalable production across multiple lines, functions, suppliers, and operating locations.

Despite substantial investment in equipment, automation, Lean methods, and performance reporting, average Overall Equipment Effectiveness across the portfolio remained at approximately 59%.

That performance level created significant exposure:

  • Insufficient capacity to support planned production volumes
  • Higher conversion costs and margin pressure
  • Unstable quality and delivery performance
  • Recurring launch and ramp-up problems
  • Continued dependence on escalation and individual intervention
  • Risk to customer commitments across a major eMobility portfolio

The organization could see the losses in its dashboards. The problem was closing them.

Issues appearing on the production floor were frequently symptoms of decisions or constraints located elsewhere. Some originated in product design. Others involved supplier capability, process assumptions, incomplete industrialization, unclear handoffs, or divided ownership between R&D, engineering, and manufacturing.

Without a connected operating model, local teams repeatedly addressed symptoms while the underlying causes remained in place. Lessons learned on one line or program were not consistently transferred to the next.

The company did not need more data. It needed a system capable of turning that data into coordinated action.

Our Approach

We assembled a team of industrialization, process engineering, and manufacturing experts to work directly with the company's product management, R&D, industrialization, process engineering, supplier quality, and factory leadership teams.

The engagement began with an end-to-end operational diagnostic covering the full path from product definition and design release through industrialization, ramp-up, and volume production.

Our experts spent full working days on production lines and inside the engineering organization, observing:

  • How product requirements were translated into manufacturing processes
  • How designs were released and handed over
  • How equipment and production lines were planned
  • How materials and components were supplied
  • How production performance was managed across shifts
  • How losses were escalated and assigned
  • How engineering and manufacturing teams worked across locations
  • How lessons from one program were transferred to others

This extended well beyond leadership interviews, portfolio reviews, and brief plant walkthroughs.

The objective was to identify the true constraints behind the portfolio's 59% average OEE, establish a consistent baseline across the programs, and determine what needed to change before prescribing a solution.

We evaluated three connected areas using the same criteria at the beginning and end of the engagement.

  1. 01

    Process

    How product designs, materials, equipment, and information moved from R&D through industrialization and into stable production.

  2. 02

    Management system

    How each program and production line planned work, established targets, used OEE and operating data, assigned ownership, and responded to availability, performance, and quality losses.

  3. 03

    Organization

    Whether local production leaders and global product, design, and process owners had the capability, authority, and accountability to close losses and prevent them from recurring.

This approach allowed us to evaluate both production performance and the operating system responsible for producing it.

What We Found

The portfolio's OEE losses did not originate from a single technical problem.

Availability, performance, and quality losses were being created by a combination of connected issues:

  • Product and process decisions were not always mature before industrialization
  • Production problems were not consistently linked back to global design or process ownership
  • Local teams could contain issues but often lacked authority to correct their source
  • Decision rights between R&D, industrialization, engineering, and manufacturing were unclear
  • Setup and changeover losses varied between lines and locations
  • Cycle-time constraints limited throughput
  • Unplanned downtime repeatedly consumed available capacity
  • Scrap and parts-per-million defects remained higher than required
  • Lessons learned were not systematically replicated across programs
  • Accountability for structural corrective action was fragmented

The company already had OEE dashboards, Lean methods, and corrective-action tools. What it lacked was a management system connecting those tools across functions and locations.

The challenge was not simply to improve individual production lines. It was to build a repeatable industrialization system capable of improving the entire portfolio.

What We Rebuilt

Working alongside company leadership, engineering teams, and factory personnel, we created a portfolio-wide performance model built around five connected elements.

  1. 01

    OEE decomposition

    OEE was separated into availability, performance, and quality losses at the line and program level. This made it possible to distinguish between equipment problems, process instability, cycle-time constraints, changeover losses, quality failures, and organizational issues rather than treating low OEE as a single problem.

  2. 02

    Layered root-cause diagnosis

    Production losses were traced beyond their immediate symptoms. When the source of a recurring problem sat in product design, supplier capability, tooling, process assumptions, or engineering ownership, the corrective action was assigned to the function capable of eliminating the cause.

  3. 03

    Local and global ownership

    We established a change-management model connecting factory-level losses with global product, design, and process owners. Local teams retained responsibility for immediate containment and daily execution. Global owners became accountable for structural corrections that extended beyond the authority or capability of an individual plant.

  4. 04

    Cross-functional decision rights

    Product management, R&D, industrialization, process engineering, supplier quality, and manufacturing were organized around shared priorities and clear decision rights. This reduced repeated escalation, shortened corrective-action cycles, and prevented critical issues from remaining trapped between functions.

  5. 05

    Portfolio-wide replication

    Lessons from one production line or facility were converted into standards that could be transferred across the broader portfolio. Improvement stopped being isolated to individual projects. Each resolved problem strengthened the industrialization system supporting the programs that followed.

Building the Organization to Sustain It

The engagement extended beyond diagnosing losses and implementing corrective actions.

We built a dedicated industrialization function from the ground up and scaled it to more than 120 people across:

  • Program management
  • Process engineering
  • Production engineering
  • Manufacturing engineering
  • Tooling and prototyping
  • Testing and validation

The organization was designed to place technical capability and decision-making closer to the work.

Recurring problems could be resolved by teams with the expertise and authority to address them, rather than being continually escalated to external consultants or a small number of senior leaders.

The objective was not to make the company dependent on our team. It was to establish the internal capability required to industrialize, launch, and improve programs repeatedly.

The Results

The operating model was applied across more than 10 industrialization projects within the eMobility portfolio.

Average OEE increased from approximately 59% to 84%. Leading production lines reached as high as 94%, approaching the portfolio target of 89% where technical and operating conditions permitted.

MeasureResult
Average portfolio OEE59% to 84%
OEE improvement25 percentage points
Peak OEE on leading production lines94%
Portfolio OEE target89%
Industrialization projects deliveredMore than 10
Product lines supportedFour
Lifetime program valueApproximately US$1 billion
Industrialization organization createdMore than 120 people

The gains were driven by sustained reductions in:

  • Setup and changeover losses
  • Unplanned downtime
  • Cycle-time bottlenecks
  • Scrap and quality defects
  • Repeated engineering and process failures
  • Delayed or unclear corrective-action ownership

These were not isolated line improvements. The company developed a repeatable mechanism for carrying lessons, standards, and corrective actions from one program or location to the next.

The Business Impact

The improvement created value beyond the OEE calculation. For the company, the new industrialization system supported:

  • Greater production capacity from existing assets
  • More predictable ramp-up across multiple programs
  • Lower conversion costs
  • Improved quality stability
  • Stronger delivery performance
  • Faster resolution of cross-functional problems
  • Better protection of customer commitments
  • Reduced dependence on reactive escalation
  • A scalable internal organization for future programs

Most importantly, improvement began to compound. Each program no longer had to solve the same problems independently. The portfolio could reuse proven processes, decision structures, and technical lessons instead of repeatedly rebuilding them.

Why the Engagement Worked

The improvement did not come from introducing another standalone tool.

OEE dashboards, Lean activities, and corrective-action processes already existed. The change came from connecting them through a leadership-led operating model.

Several factors were critical:

  • Diagnosing the complete industrialization system before prescribing solutions
  • Separating immediate containment from structural corrective action
  • Connecting local production losses to global design and process ownership
  • Establishing clear cross-functional decision rights
  • Building internal industrialization capability alongside the performance improvements
  • Replicating lessons across programs rather than leaving them within individual teams

The result was not simply higher OEE. It was a more capable system for turning product designs into stable, scalable production.

The United Ops Engagement Model

United Ops assembles the right combination of operators, industrialization leaders, engineering specialists, technology experts, and organizational resources around the specific business outcome.

We begin with the operating constraint, not a predetermined methodology. Our experts work directly with company leadership and frontline teams to identify the true source of performance loss, build the appropriate solution, support implementation, and establish the internal capability required to sustain the gains.

For complex industrialization portfolios, the objective is not simply to improve one production line. It is to build a system that makes performance repeatable.

Connect the functions. Close the losses. Scale what works.

Are launches and ramp-ups repeating the same problems?

If each program solves the same issues from scratch, the constraint is usually the industrialization system rather than any single line. Let's look at where the losses actually originate.

Related case studies

All case studies
Wide aisle of a modern manufacturing plant with material staged alongside the production line.

Industrial Manufacturing

From Firefighting to Flow

Recurring stoppages and rising unit costs looked like an equipment problem. The real constraint was material flow, frontline leadership, and daily management discipline.

63%
Productivity increase
39%
Lower cost per kilogram
15 pts
OEE improvement
Read the case study
Specialty materials quality laboratory with inspection instruments and sample trays on a clean bench.

Specialty Materials and Quality Systems

From Repeat Failures to Permanent Resolution

Complaints were being closed, but the same failures kept returning. The investigations had stopped before reaching the conditions that allowed them.

US$1M
Repeat quality cost reduction
Three
Major issues resolved
6 months
Implementation
Read the case study