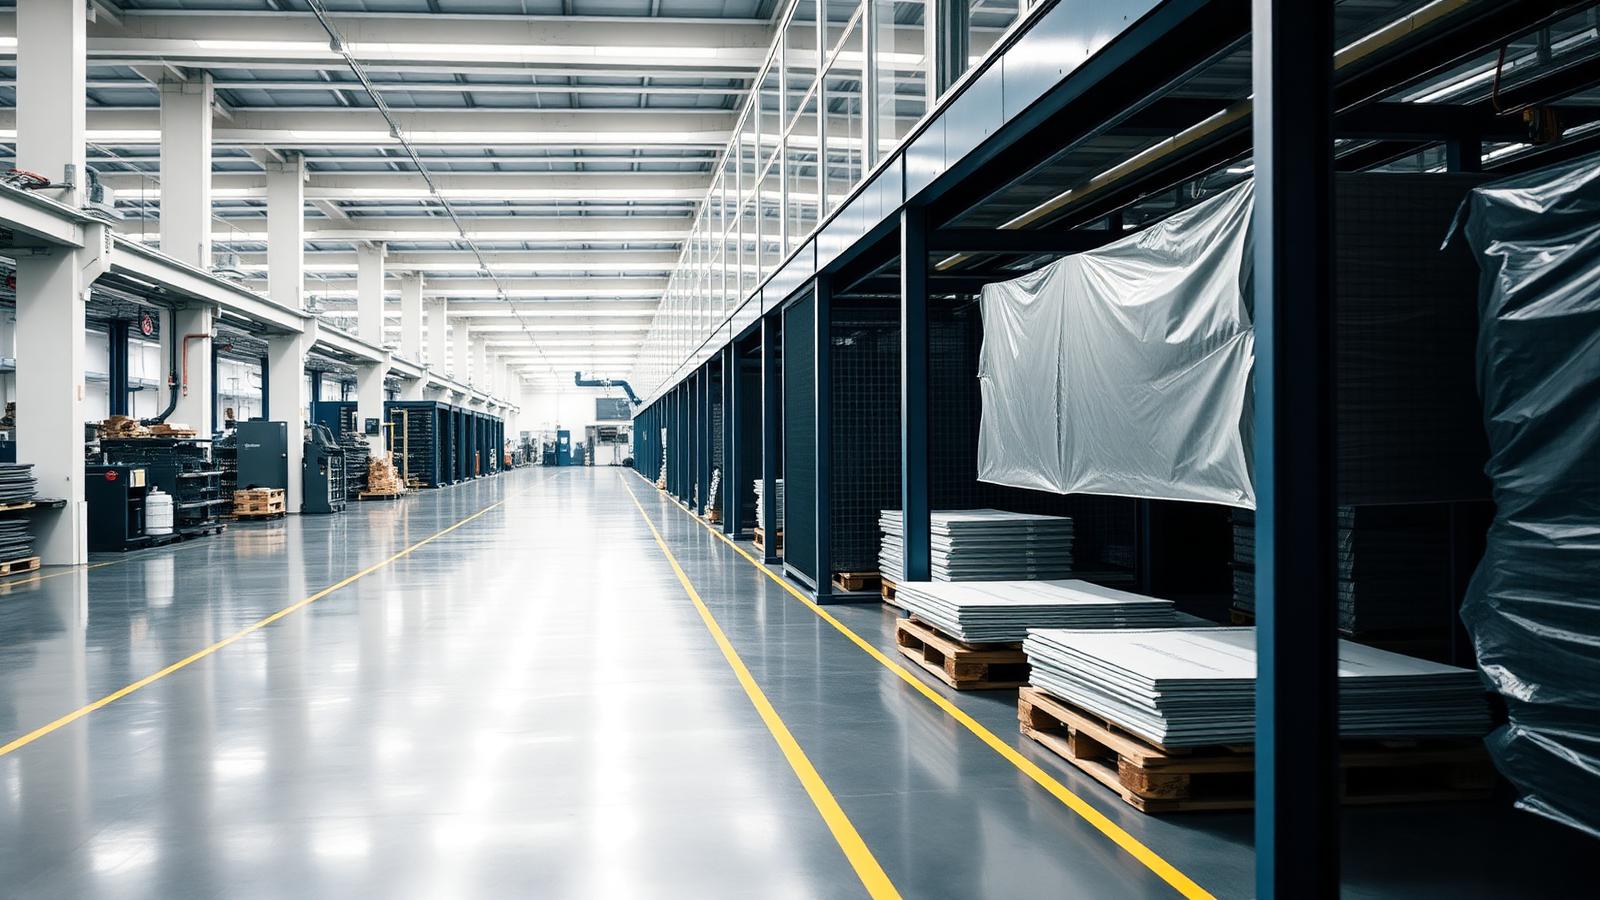
Wide aisle of a modern manufacturing plant with material staged alongside the production line.

Industrial Manufacturing

From Firefighting to Flow

Rebuilding plant performance without significant capital investment, delivering a 63% productivity increase in seven months.

63%
Increase in productivity
39%
Reduction in manufacturing cost per kilogram
15 pts
Improvement in OEE
7 months
Implementation

The Challenge

An industrial supplier was experiencing recurring machine stoppages, inconsistent production, rising unit costs, and an operating environment dominated by daily firefighting.

The apparent solutions were familiar: implement Lean, increase automation, conduct another improvement event, or invest in new equipment.

Our initial assessment pointed elsewhere. The operation lacked the material flow, frontline leadership, performance visibility, and daily management discipline needed to run consistently. Previous improvement efforts had addressed individual symptoms, but the underlying operating system had not been rebuilt.

Our Approach

We assembled a team of experts to work directly with the company's leadership, supervisors, planners, logistics personnel, shift coordinators, and frontline operators.

The engagement began with an end-to-end operational diagnostic covering the flow of material, information, and finished product, from customer requirement through delivery.

Our team spent full working days inside the operation, observing how production was actually planned, supplied, supervised, and managed across shifts. This extended well beyond management interviews, surveys, and a brief plant walkthrough.

The objective was to identify the true operating constraints, establish a measurable baseline, and determine what needed to change before prescribing a solution.

We assessed three connected areas using the same criteria at the beginning and end of the engagement:

  1. 01

    Process

    How material, information, and product moved through the operation.

  2. 02

    Management system

    How the operation planned, established targets, used data, and responded to performance gaps.

  3. 03

    Organization

    Whether frontline leaders had the capability, authority, and accountability to run the operation effectively.

What We Found

The primary source of machine stoppages was not equipment failure.

Operators were repeatedly leaving their workstations to retrieve raw material and move finished pallets. Production stopped while they performed work that should have been handled through a defined material-flow system.

That disruption was compounded by several connected problems:

  • No consistent shift leadership
  • No clear daily production targets
  • Nonstandard startup, changeover, and cleaning routines
  • Limited production planning and deviation analysis
  • Insufficient performance data at the supervisor level
  • Preventive-maintenance gaps contributing to avoidable downtime

The production supervisor possessed strong technical knowledge but lacked the management routines, planning tools, and timely information needed to run the line against a defined plan.

The operation did not need new machinery. It needed a better way to operate.

What We Rebuilt

Working alongside company leadership and frontline personnel, our team implemented six connected improvements.

  1. 01

    Material flow

    Raw materials were positioned and replenished at the point of use so operators could remain at their workstations. Responsibility for moving finished products was reassigned so it no longer interrupted production.

  2. 02

    Standard work

    Startup, changeover, cleaning, and shift-transition routines were standardized across the operation.

  3. 03

    Frontline leadership

    Supervisors and shift coordinators were trained and empowered to manage daily production. Development focused on practical planning, target setting, performance review, deviation analysis, and corrective action.

  4. 04

    Performance visibility

    The ERP data feed was modified and connected to a KPI dashboard, giving supervisors timely production information instead of delayed reports and assumptions.

  5. 05

    Equipment reliability

    Preventive-maintenance routines were strengthened to address equipment-related contributors to downtime.

  6. 06

    Daily management

    Structured tier meetings created a consistent operating rhythm for reviewing results, escalating constraints, assigning ownership, and closing performance gaps.

Making the Improvements Last

The engagement did not end when the new processes went live.

We built a follow-through phase into the project to reinforce the new routines, address early deviations, and transfer full ownership to company leadership.

This was essential because operating systems do not sustain themselves. The organization must be able to maintain standards, use performance data, develop frontline leaders, and respond when results begin to drift.

The goal was not to create temporary improvement dependent on outside consultants. It was to leave the company with a stronger system it could continue operating.

The Results

Within seven months, the company achieved substantial improvements in productivity, manufacturing cost, equipment effectiveness, and operating-system maturity.

Operational performance
MetricResult
Productivity, measured as kilograms per hour per operator63% increase
Manufacturing cost per kilogram produced39% reduction
Overall Equipment Effectiveness15-point increase
Operating-system maturity, scored with the same structured assessment at the beginning and end of the engagement
Assessment areaStarting scoreEnding score
Process21%90%
Management system5%91%
Organization8%93%

The production metrics demonstrate the immediate business impact. The assessment scores show that the underlying operating system changed as well.

Process discipline, management capability, and organizational ownership improved together. The company did not simply produce more for a short period. It developed a more capable and sustainable way to operate.

The Business Impact

The engagement created value beyond the production line:

  • Greater output from existing equipment and labor
  • Lower manufacturing cost per unit
  • Additional capacity without significant capital investment
  • Stronger margins on already-quoted business
  • More consistent delivery and customer-scorecard performance
  • Faster identification and correction of operating problems
  • Less dependence on individual managers to hold the system together

How the Results Were Measured

Productivity and manufacturing-cost improvements were measured using ERP-based production data.

Changes in process discipline, management capability, and organizational ownership were measured using the same structured assessment criteria at the beginning and end of the engagement.

Together, these measures demonstrated both the immediate operating results and the company's ability to sustain them.

The United Ops Engagement Model

United Ops assembles the right team of experienced operators, functional specialists, technology experts, and leadership resources around the specific business outcome.

We begin with the operating problem, not a predetermined tool or methodology. Our experts work directly with company leadership and frontline personnel to identify the real constraints, build the appropriate solution, support implementation, and establish the internal capability needed to sustain the gains.

If productivity, cost, capacity, or delivery performance is falling short, the first step is determining where the real constraint sits.

Let's identify what is limiting performance before deciding what to change.

Is daily firefighting holding your plant back?

Tell us where productivity, cost, or delivery performance is falling short. We will help determine where the real constraint sits before recommending what to change.

Related case studies

All case studies
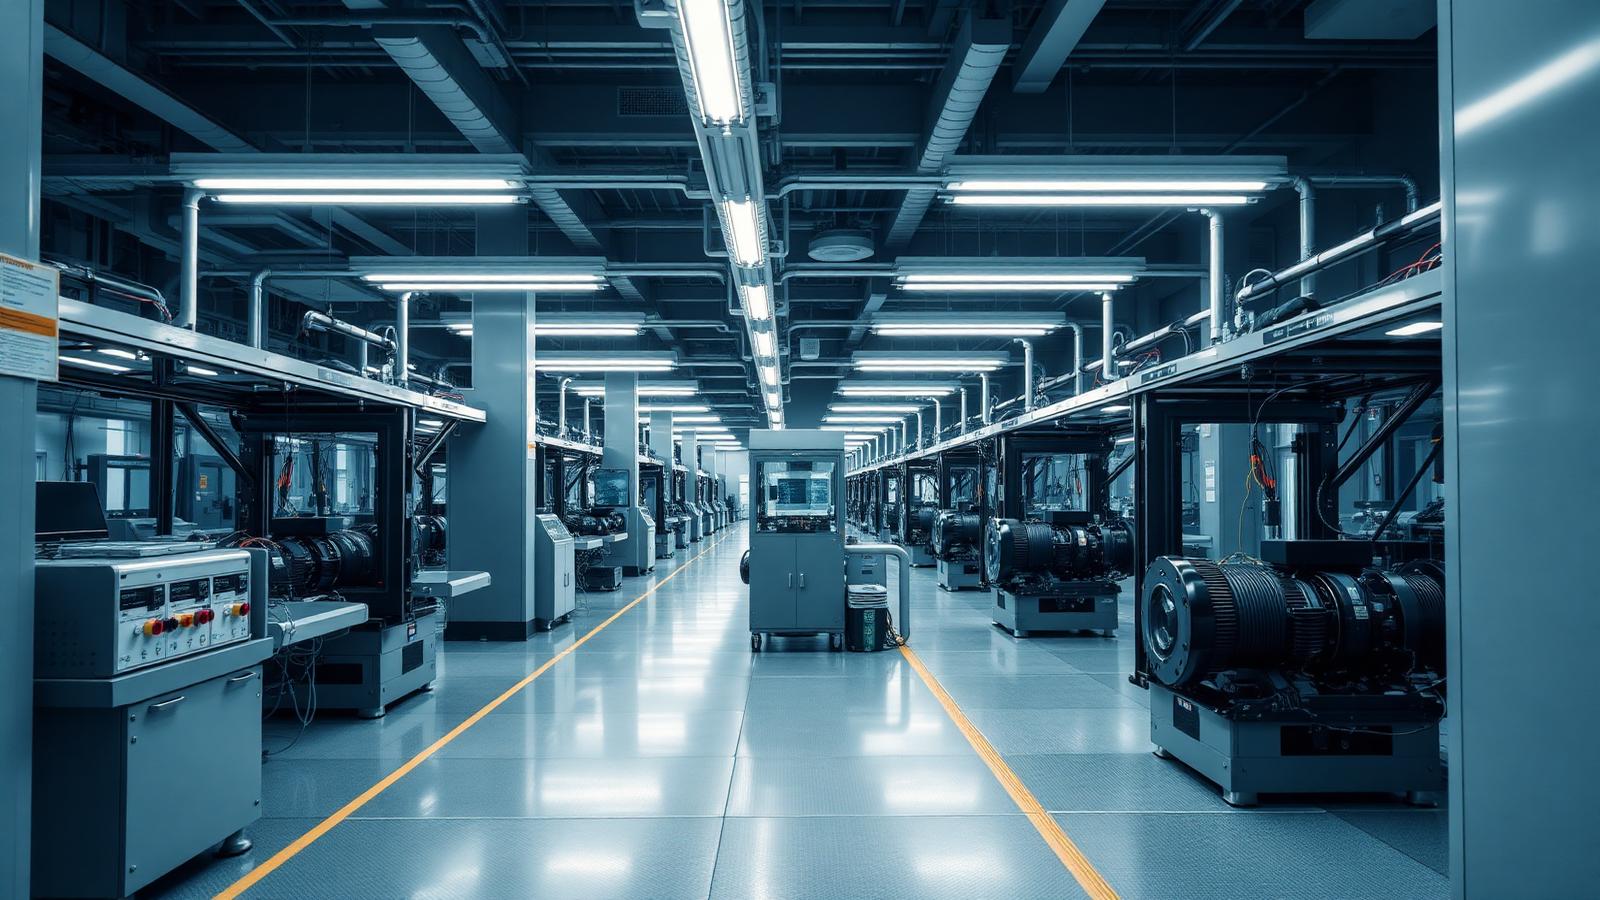
Precision electric drive assembly line with automated stations in a clean production hall.

Automotive Electronics and eMobility

From Fragmented Launches to Repeatable Performance

Dashboards already showed the losses. What the portfolio lacked was a management system able to turn that data into coordinated action across R&D, engineering, and manufacturing.

59% to 84%
Average portfolio OEE
10+
Projects delivered
120+
Person organization built
Read the case study
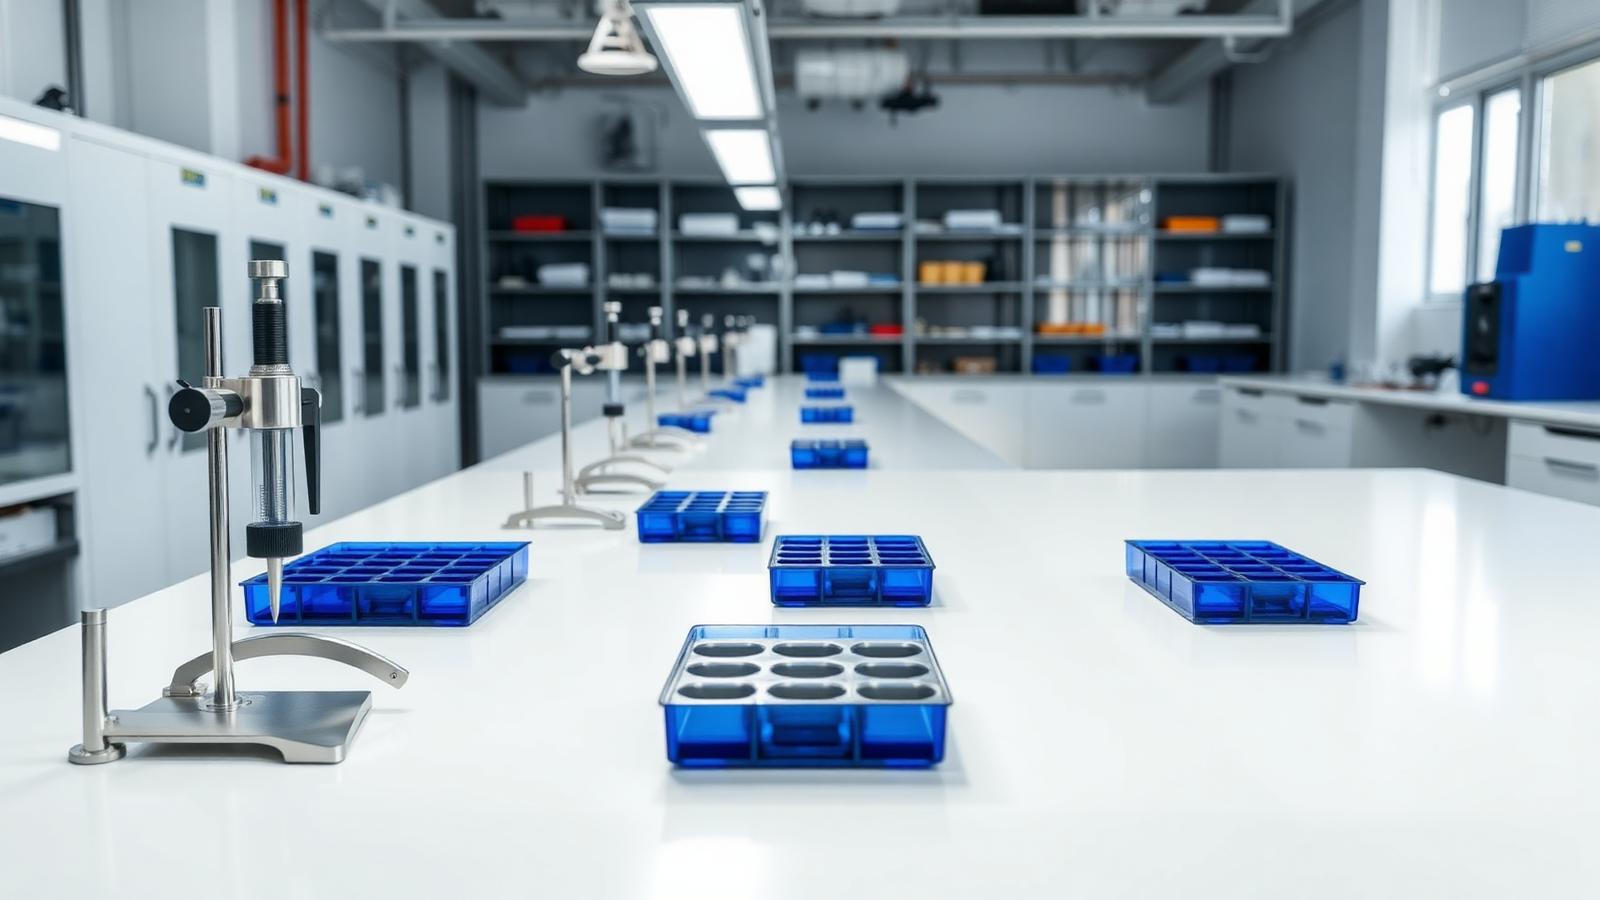
Specialty materials quality laboratory with inspection instruments and sample trays on a clean bench.

Specialty Materials and Quality Systems

From Repeat Failures to Permanent Resolution

Complaints were being closed, but the same failures kept returning. The investigations had stopped before reaching the conditions that allowed them.

US$1M
Repeat quality cost reduction
Three
Major issues resolved
6 months
Implementation
Read the case study